Covid, Cholera, Water Pumps and ATM’s

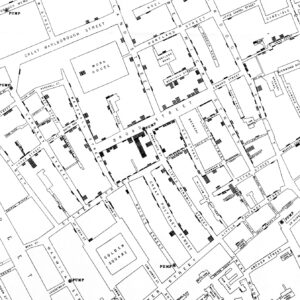
After attending a talk on data visualisation I was reflecting on the work of John Snow and the early use of data visualisation via mapping in 1854.  John produced maps showing the location of water pumps and the prevalence of the disease cholera which was causing many deaths at the time. By plotting the number of deaths as bars at their geographic location and also the locations of water pumps a pattern emerged. In particular it was noted that around a pump in Broad Street Soho, there were a high number of deaths. Also at a brewery where workers had access to a private water supply there were less deaths. Up to that point the disease was thought to be spread through the air.  By careful data collection, generating useful maps and gaining insight from the story they told, it was possible to trace the infection sources to poor water quality.  Subsequent action taken directly from the data mapping saved numerous lives.


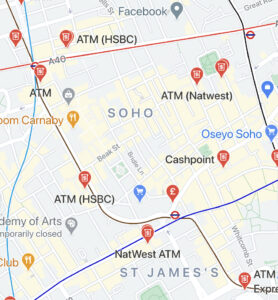
Disease mapping and the efforts of the track and trace app are the latest version of this effort of match disease data with geolocation. With Covid-19 infection data available for every postcode in the UK, what are todays Broad Street water pumps and Soho brewery equivalents?  Interestingly one of the services still in use during the lockdowns that also require human contact are ATM’s and cashpoints. It just so happens that both google maps and most of the banks provide this information via API’s. An interesting question is therefore, are there ATM and Covid-19 hotspots? Is there a relationship between the location and use of cashpoints and Covid19 transmission? Are some machines cleaned more frequently than others and does this matter? Are there any other services from which mapping data and Covid-19 infections can draw unexpected but useful insight?

To start the experiment the first step is to collect the data. For me that looks like accessing API’s:

NHS Developer Portal

https://developer.api.nhs.uk/coronavirus


Banking API’s

https://developer.lloydsbank.com/

https://developer.santander.co.uk/sanuk/external/atms

https://developer.barclays.com/catalogue


The next step is to play around with these. If the most dangerous ATM in the country can be found you’ll at least know whether to take one or two bottles of hand sanitiser with you the next time you use cash (if indeed you ever need to again!!!).


Data Visualisation – Making the Invisible, Visible

I attended a fantastic Royal Institution event today – Data visualisation: seeing, sensing, stimulating from  Valentina D’Efilippo – @defilippovale

It started with a historical context and problem solving in the 1800’s. John Snow mapped the outbreak of cholera in Soho and noticed the proximity of high infection rates to certain street water pumps. Concentrations around Broad Street (todays Broadwick Street) were observed as a source of the disease which was confirmed when the pump handle was removed. Also note worthy were the lack of cases at the nearby brewery proving the health benefits of beer? A great early use of data science and visualisation.

Giving more modern examples, a plethora of Covid 19 data visualisation charts were shown and the importance of these in telling the story of what is happening. The “flatten the curve” charts have been a really good visualisation and story telling vehicle with great impactful on policy and the public response.

Overall the importance of both hearts and minds was emphasised by the emphasis on both the Science and Art. The science comprising of data and statistics. The art more concerned with graphic design and visual story telling.

A few other noteworthy things to follow up in my notes:

William Playfair – The inventor of modern pie charts / graphing / charting

Global warming colour spectrum  – a colour plot telling the compelling story of climate change

Data Design Principles

  • Data – as creative material
  • Design – as a tool to aid understanding

3 steps to an impactful visualisation:

  • See – make data visible
  • Sense  – the implications should be clear
  • Stimulate – the data should drive action

The presenter has produce a book:  Infographic History of the World – book by the author

She gave three examples

Example 1

Which was the most significant war – 133 wars 95 M deaths
She used inspiration from science, art, nature
Looking at Poppy and its significance – using flower size, stem length and height to represent the data

See http://poppyfield.org

Example 2

What would music look like through data visualisation?

Using David Bowie for inspiration and his song Space Oddity which in turn was influenced by the film 2001  a Space Odessy and by the 1960’s Apollo Moon missions. Some of the techniques used included:

  • Zoom into the grooves!
  • Major Tom and Ground Control characters represented and their distance apart
  • Visual form to the music itself

Overall the data was the vehicle to explain human experiences.

Example 3

Social Media force for change – MeToomentum.com from the impactful movement from the Alyssa Milano tweet @Alyssa_Milano

The visualisation used the Dandelion metaphor with the following attirbutes

  • Spreading – geography
  • Rooting – what themes / what / where / who
  • Trending – popularity – loudest voices / re-tweets / followers

A powerful way to show – creators have the power to shape the way others understand the world!

A great summary at the end – data visualisation provides a snapshot of a complex world

@defilippovale

Question and answers session:

Dataforc
hange – hear the blind spot – google search this – bring data to life through sound

First thing to do when creating a visualisation:

Who are we talking to and what are we trying to do?

Tools

Visualisation book – Excel / Adobe Illustrator

For the websites and other projects::

E3 – javascript library and SVG’s

Tableau

Datagraph

Dataillustrator Beta

Rawgraph.io

Also interesting

Mapping disease: John Snow and Cholera:

https://www.rcseng.ac.uk/library-and-publications/library/blog/mapping-disease-john-snow-and-cholera/

Conference Paper Video With Bizarre Pandemic Timing

When you’re strange…

Possibly the oddest conference presentation ever. People from around the globe presenting papers remotely to an IEEE conference in China just after midnight on New Years Eve to New Years Day. The conference had to be postponed due to the pandemic and the new timing meant my presentation had to be at a session starting at the very dawn of the new year, remote, and also that recordings had to be provided in case the tech failed (recording below). I’m not sure how many of the delegates and presenters were sober but it made for a memorable, if not strange experience. Sorry but I had to miss Jools Holland this time!

Paper ID: IEEE TrustCom 2020 

Title: Enhancing Cyber Security Using Audio Techniques: A Public Key Infrastucture for Sound  

Conference: The 19th IEEE International Conference on Trust, Security and Privacy in Computing and Communications (IEEE TrustCom 2020), Guangzhou, China, December 29, 2020 – January 1, 2021

Conference Website: http://www.ieee-trustcom.org/TrustCom…

COVID-19 RISK – DATA VISUALISATIONS & RESOURCES

Here are some useful data visualisation sites detailing the impact of Covid-19 in different geographies, scenarios and contexts. Some are more useful than others in aiding the understanding of risk:

UK Government:

Summary: https://coronavirus.data.gov.uk

Cases:   https://coronavirus.data.gov.uk/details/cases

Information is Beautiful

A great overview site highlighting not only cases but risk factors:

https://informationisbeautiful.net/visualizations/covid-19-coronavirus-infographic-datapack/

Covid-19 Charts

https://covid-19-charts.net/

Our World in Data

https://ourworldindata.org/coronavirus

Worldometers

https://www.worldometers.info/coronavirus/

World Covid Stats

https://ncov2019.live/

COVID-19 Data Repository by the Center for Systems Science and Engineering (CSSE) at Johns Hopkins University

https://github.com/CSSEGISandData/COVID-19

World Health Organisation

https://www.who.int/emergencies/diseases/novel-coronavirus-2019

The Royal Society | David Spiegelhalter Communicating statistics in the time of Covid

From an excellent talk from David Spieglehalter (link at the bottom) he points out that to build trust, the communications must. be transparent and that:

  1. Data must be accessible – you must be able to get at the data.
  2. Comprehensible – complete and understandable
  3. Usable – it must answer concerns it is generated for
  4. Assessable – can you check the working out? What claims are made?